Programming your Pictures in Haskell

Aidan Delaney & Brent Yorgey

| @aidandelaney
| https://byorgey.wordpress.com/

Introduction

DSL

  • Diagrams is a Domain Specific Language
  • Uses many combinators to compose diagrams.
  • Layout is handled in horizontal and vertical boxes
    • similar to GTK
  • Excellent documentation

Wide usage

Usage

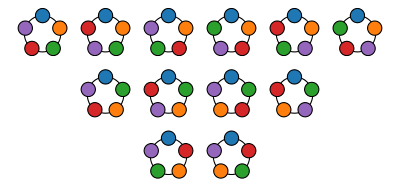
Particularly useful for programmatic generation of large numbers of diagrams. For instance Bracelets. Backends exist for SVG, PNG, PDF, HTML 5 canvas and GTK.

https://byorgey.files.wordpress.com/2015/07/9bf376e5e3d8e6ab.png?w=640

Takeaways

  1. Declarative drawing of diagrams allows separation of concerns.
  2. Declarative drawing assists in rapid prototyping of visualisation.

First Steps

Haskell

Functions are defined with a type signature:

example :: Diagram B

defines a function to return a Diagram B. Both Diagram and B are defined by the diagrams module.

Functions are implemented as such:

example = circle 1

Primitives

example :: Diagram B
example = circle 1 ||| square 1 ||| pentagon 1

See TwoD-Shapes documentation for full details.

Points & Vectors

Diagrams doesn't conflate 2d points with 2d vectors! Many, many graphics APIs do -- and that annoys me.

r2 (3, 3) -- a vector
p2 (3, 3) -- a point

Beside

Rather than side-by side positioning we can:

example :: Diagram B
example = beside (r2 (0.5, 0.5)) (circle 1) (square 1)

Multiple Combinators

example3 :: Diagram B
example3 = (circle 2 === square 1) ||| pentagon 3

# Attributes

example2 :: Diagram B
example2 = circle 2 # lc blue ||| pentagon 3

# is simply a postfix function so circle 1 # lc blue is lc blue (circle 1)

More Attributes

example4 :: Diagram B
example4 = ((circle 2 # lc blue === square 1) # centerY ||| pentagon 3 # centerY)

Horizontal composition

example5 :: Diagram B
example5 = hcat [(circle 2 # lc blue === square 1)
                 , pentagon 3, triangle 4]

Vertical composition

example6 :: Diagram B
example6 = vcat [circle 2 # lc blue
                 , square 1
                 , pentagon 3]

Envelopes

> example6 :: Diagram B
> example6 = vcat [circle 2 # lc blue # showEnvelope' (with & eColor .~ green)
>                 , square 1
>                 , pentagon 3] # centerY # showEnvelope' (with & eColor .~ red)

Case Study

Tree Viz

We'll create a tree and visualise it's recursive structure.

Tree

The following is one way of implementing a binary tree.

data Tree = Leaf | Branch Tree Tree

Visualisation

We'll visualise each leaf as a square:

square 1

Patterns

We can use haskell's pattern matching to build our visualisation.

boxes :: Tree -> Diagram B
boxes Leaf = ...
boxes (Branch l r) = ...

Danger

Live demo from here on -- I shouldn't do this, but here we go.

Conclusion

Takeaways

  1. Declarative drawing of diagrams allows separation of concerns.
  2. Declarative drawing assists in rapid prototyping of visualisation.

References